.svg)

Author: Syb Vanke, Founder of SFN AI | Last Updated: March 2026 | Reading Time: 18 min
Primary Keyword: tiktok shop affiliate analytics | Format: Deep-Dive Guide
Eighty percent of TikTok Shop affiliate programs track one metric: GMV.
They celebrate when it goes up. They panic when it goes down. And they have zero idea why either happens.
Here's the problem with GMV as your north star: a program generating $500K per month in gross merchandise value can be hemorrhaging money. After commission payouts, TikTok's 6% platform fee, fulfillment costs, and a 12% return rate, that $500K might leave $40K in actual profit — or negative margin if your commission structure is off by three points.
The brands that plateau at month three aren't failing because creators stop posting. They're failing because they can't see what's working, what's bleeding money, and which creators are actually driving profitable revenue versus vanity volume.
TikTok Shop's native analytics weren't built for this. The Seller Center dashboard shows orders and revenue. The Ads dashboard shows impressions and clicks. They don't talk to each other. And neither one tells you the metric that actually matters: contribution margin per creator per SKU.
This guide covers the complete analytics framework for TikTok Shop affiliate programs — the three layers of metrics that separate programs generating revenue from programs generating profit, how to solve TikTok's attribution problem, how to measure the Halo Effect most brands ignore entirely, and the reporting cadence that keeps your program optimized week over week.
TLDR: TikTok Shop affiliate analytics requires three measurement layers — foundational metrics (GMV, orders, AOV), conversion metrics (video-to-click rate, content velocity, coherence), and financial metrics (blended ROAS, contribution margin per SKU, LTV:CAC). Most programs only track Layer 1 and miss the signals that determine profitability. TikTok's default last-click attribution undervalues awareness creators, and the Halo Effect — where TikTok content lifts Amazon, DTC, and YouTube revenue by 30-50% — goes completely unmeasured by most teams.
Why Most Programs Measure the Wrong Things
The measurement problem starts with TikTok Shop's own infrastructure.
TikTok Seller Center and TikTok Ads Manager are separate dashboards with separate data. Your Shop dashboard shows affiliate orders, GMV, and commission payouts. Your Ads dashboard shows video views, impressions, click-through rates, and ad spend. The two systems don't share data natively. If a creator's organic video drives 10,000 views and 47 purchases, you see the purchases in Seller Center but you can't connect them to the specific content performance metrics in Ads Manager without manual work.
This dashboard split creates a blind spot. Most affiliate managers live in Seller Center because that's where the revenue lives. But Seller Center doesn't tell you why revenue happened. It doesn't show you which hook style converted, which content format drove the highest click-to-purchase rate, or which creator's audience is most likely to buy again. It shows outcomes without causes.
Then there's the attribution trap. TikTok defaults to last-click attribution — the last creator a buyer interacted with before purchasing gets full credit. This systematically undervalues creators who drive awareness and consideration. A creator with 2 million followers who introduces your product to 500,000 new viewers gets zero credit if the buyer later clicks through a nano-creator's video to purchase. The awareness creator did the heavy lifting. The nano-creator got the attribution.
According to research from the Interactive Advertising Bureau (IAB), last-click attribution models misattribute 40-60% of conversion credit in multi-touch consumer journeys. On TikTok Shop, where the average buyer sees 3-5 pieces of creator content before purchasing, this distortion is even more pronounced.
The final blind spot is the Halo Effect. TikTok Shop affiliate content doesn't just drive TikTok purchases. It lifts Amazon search volume, DTC site traffic, YouTube product searches, and branded Google queries. Industry analysis suggests this cross-platform lift ranges from 30-50% of incremental revenue — meaning if you're only measuring Shop GMV, you're understating your true affiliate ROI by nearly half.
For the complete overview of TikTok Shop's affiliate model and where analytics fits in the broader strategy, see our hub guide: TikTok Shop Affiliate Marketing: The Complete 2026 Guide.
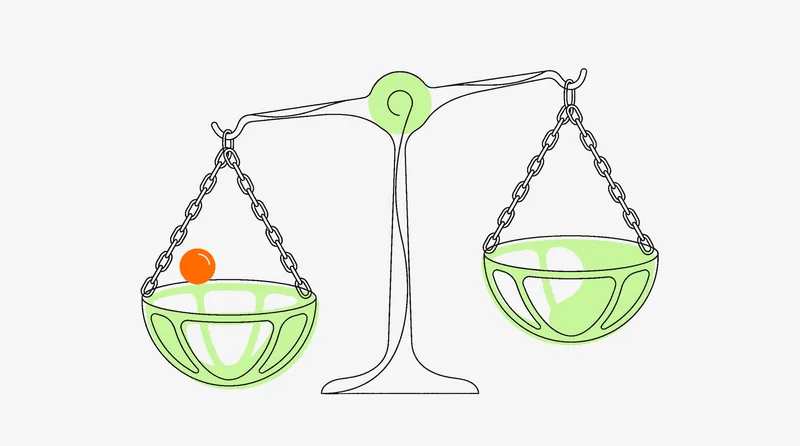
GMV tells you the program is moving. It doesn't tell you whether it's moving in the right direction.
The Three-Layer Metrics Framework
The Three-Layer Metrics Framework separates vanity from signal. Each layer answers a different question about your affiliate program's health — and most teams never get past Layer 1.
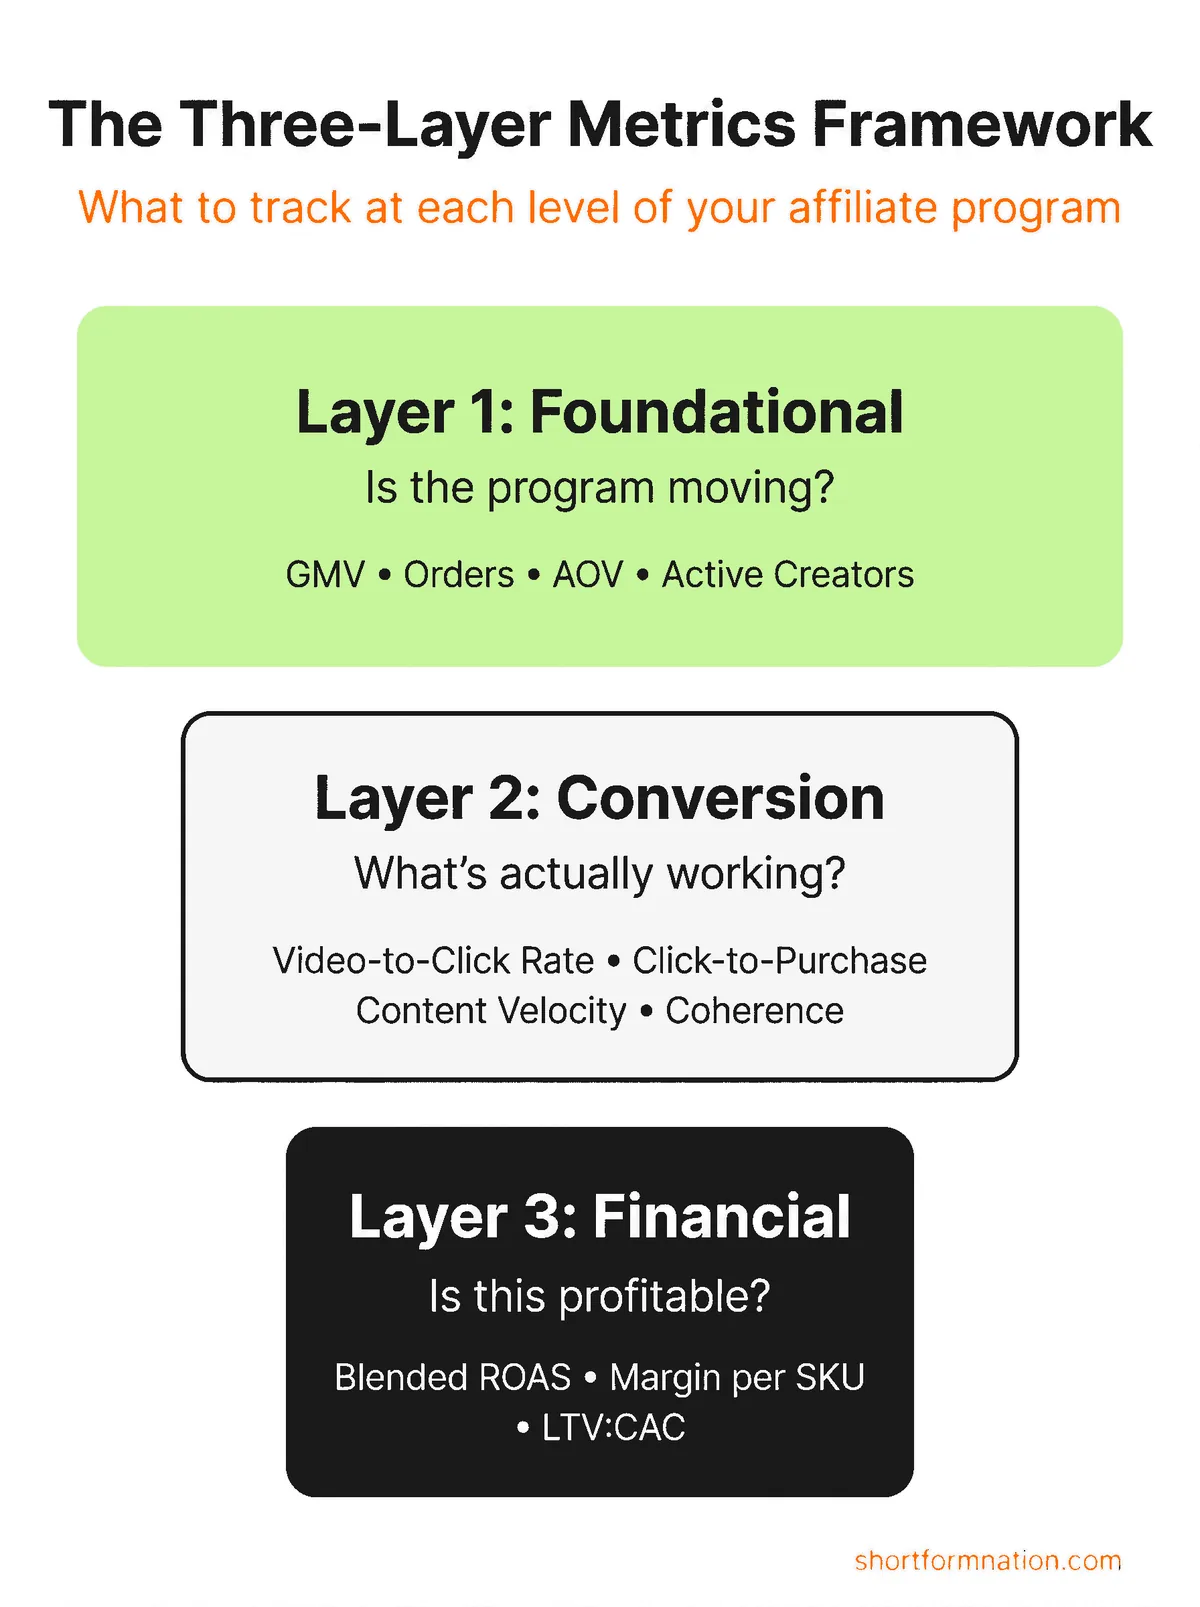
The Three-Layer Metrics Framework — what to track at each level
Layer 1: Foundational Metrics — Is the Program Moving?
These are your top-line health signals. They tell you whether the program is alive, growing, or stagnating.
Gross Merchandise Value (GMV) is the total revenue generated through affiliate links. It's the number everyone tracks — and it's necessary but insufficient. GMV without cost context is a vanity metric.
Total Orders shows purchase volume independent of order value. A sudden spike in orders with flat GMV means your average order value is dropping — possibly because creators are pushing lower-priced items or discounts are eroding basket size.
Average Order Value (AOV) reveals what buyers are actually spending per transaction. TikTok Shop's average AOV sits around $35-45 depending on category, significantly lower than traditional e-commerce ($60-80). Monitor AOV trends weekly — declining AOV with stable GMV means you need more volume just to maintain revenue.
Active Creator Count is the number of affiliates who posted at least once in the trailing 7 days. This matters more than total signups. A program with 2,000 affiliates and 200 active creators has a 10% activation rate — industry average for Open Collaboration sits at 12-18%. Below 10% and your onboarding or commission structure needs work.
Layer 1 metrics answer one question: "Is the program alive?" They tell you volume and velocity but nothing about efficiency or profitability. If Layer 1 is all you track, you're flying blind on the metrics that determine whether this is a business or a hobby.
For the detailed breakdown of how commission structures affect these foundational metrics, see: TikTok Shop Affiliate Commission Rates: What Brands Should Offer.
Layer 2: Conversion Metrics — What's Actually Working?
This is where measurement gets useful. Layer 2 tells you which creators, content formats, and product-creator pairings are driving real conversion — not just views.
Video-to-Click Rate measures what percentage of viewers click the product link in a creator's video. Average across TikTok Shop sits at 1.5-3.5% depending on content format and niche. Demo-style videos in beauty average 3.2%. Talking-head reviews in supplements average 1.8%. This metric tells you whether content is generating purchase intent.
Click-to-Purchase Rate measures what percentage of clickers actually buy. This is where product-market fit shows up. TikTok Shop's overall average conversion rate sits at 4.7% — significantly higher than traditional e-commerce's 2-4%. But the variance is enormous. Beauty products with strong creator demos hit 6-9%. Electronics with complex value propositions sit at 1.5-2.5%.
Content Velocity is the number of affiliate videos posted per creator per week. This metric predicts GMV more reliably than follower count. Creators posting 5+ times per week generate 3.2x higher GMV than creators posting twice weekly — not because frequency itself drives sales, but because more posts mean more angles tested, more audiences reached, and more conversion data generated.
Content Coherence measures how closely a creator's video matches the recommended content pattern. This is the metric most programs miss entirely. A creator can have high views but low conversion because their content drifts from the proven angles. Creators with coherence scores above 90% average 6.9x higher earnings per video than those below 60%. The gap isn't effort — it's alignment.
For how to structure briefs that drive high content velocity and coherence, see: How to Write TikTok Shop Affiliate Briefs That Creators Actually Use.
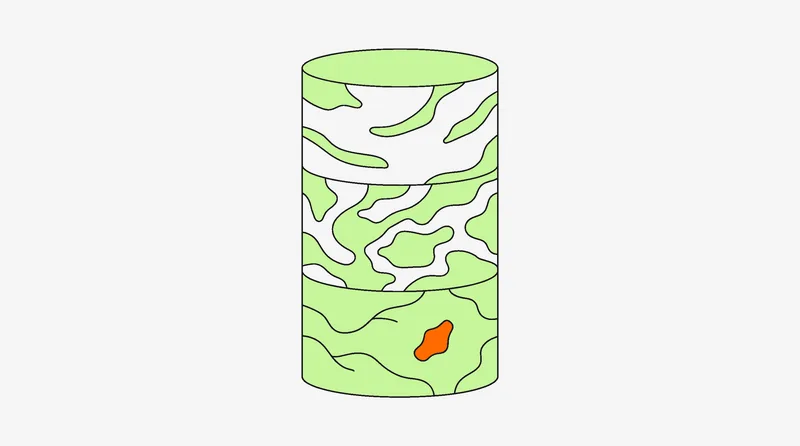
Layer 3: Financial Metrics — Is This Profitable?
Layer 3 is where most programs fail. They never calculate it. And it's the layer that determines whether your affiliate program is a business or a money-burning content machine.
Blended ROAS (Return on Ad Spend) isn't just for paid ads. Calculate blended affiliate ROAS as: total affiliate GMV ÷ total program costs (commission + management overhead + samples + tools). A healthy TikTok Shop affiliate program targets 5:1 or better blended ROAS. Below 3:1 and you need to restructure commissions or cull underperforming creators.
Contribution Margin Per SKU is the metric that tells you whether each product is actually profitable through the affiliate channel. Formula: revenue per unit – (COGS + platform fee + commission + processing + fulfillment + returns reserve). On a $50 beauty product at 15% commission, typical contribution margin lands at 20-25% — roughly $10-12.50 per unit. A 3-point swing in commission can flip this from profitable to breakeven.
For the complete unit economics breakdown by product category, see: TikTok Shop Creator Payment Models: Retainers vs Commission vs Hybrid.
Lifetime Value to Customer Acquisition Cost (LTV:CAC) connects affiliate-driven customers to long-term value. If an affiliate brings in a customer at $15 acquisition cost (commission + proportional overhead) and that customer's 12-month LTV is $85, your LTV:CAC ratio is 5.7:1 — excellent. Below 3:1 and the economics don't sustain. The challenge: TikTok Shop doesn't natively track customer-level LTV. You need to match affiliate-sourced orders to your DTC CRM or Shopify analytics to calculate this.
The shift from "we're generating revenue" to "we're generating profitable revenue" happens at Layer 3. If you're not calculating contribution margin per SKU, you don't actually know whether your affiliate program makes money.
Attribution: The Hardest Problem in Affiliate Analytics
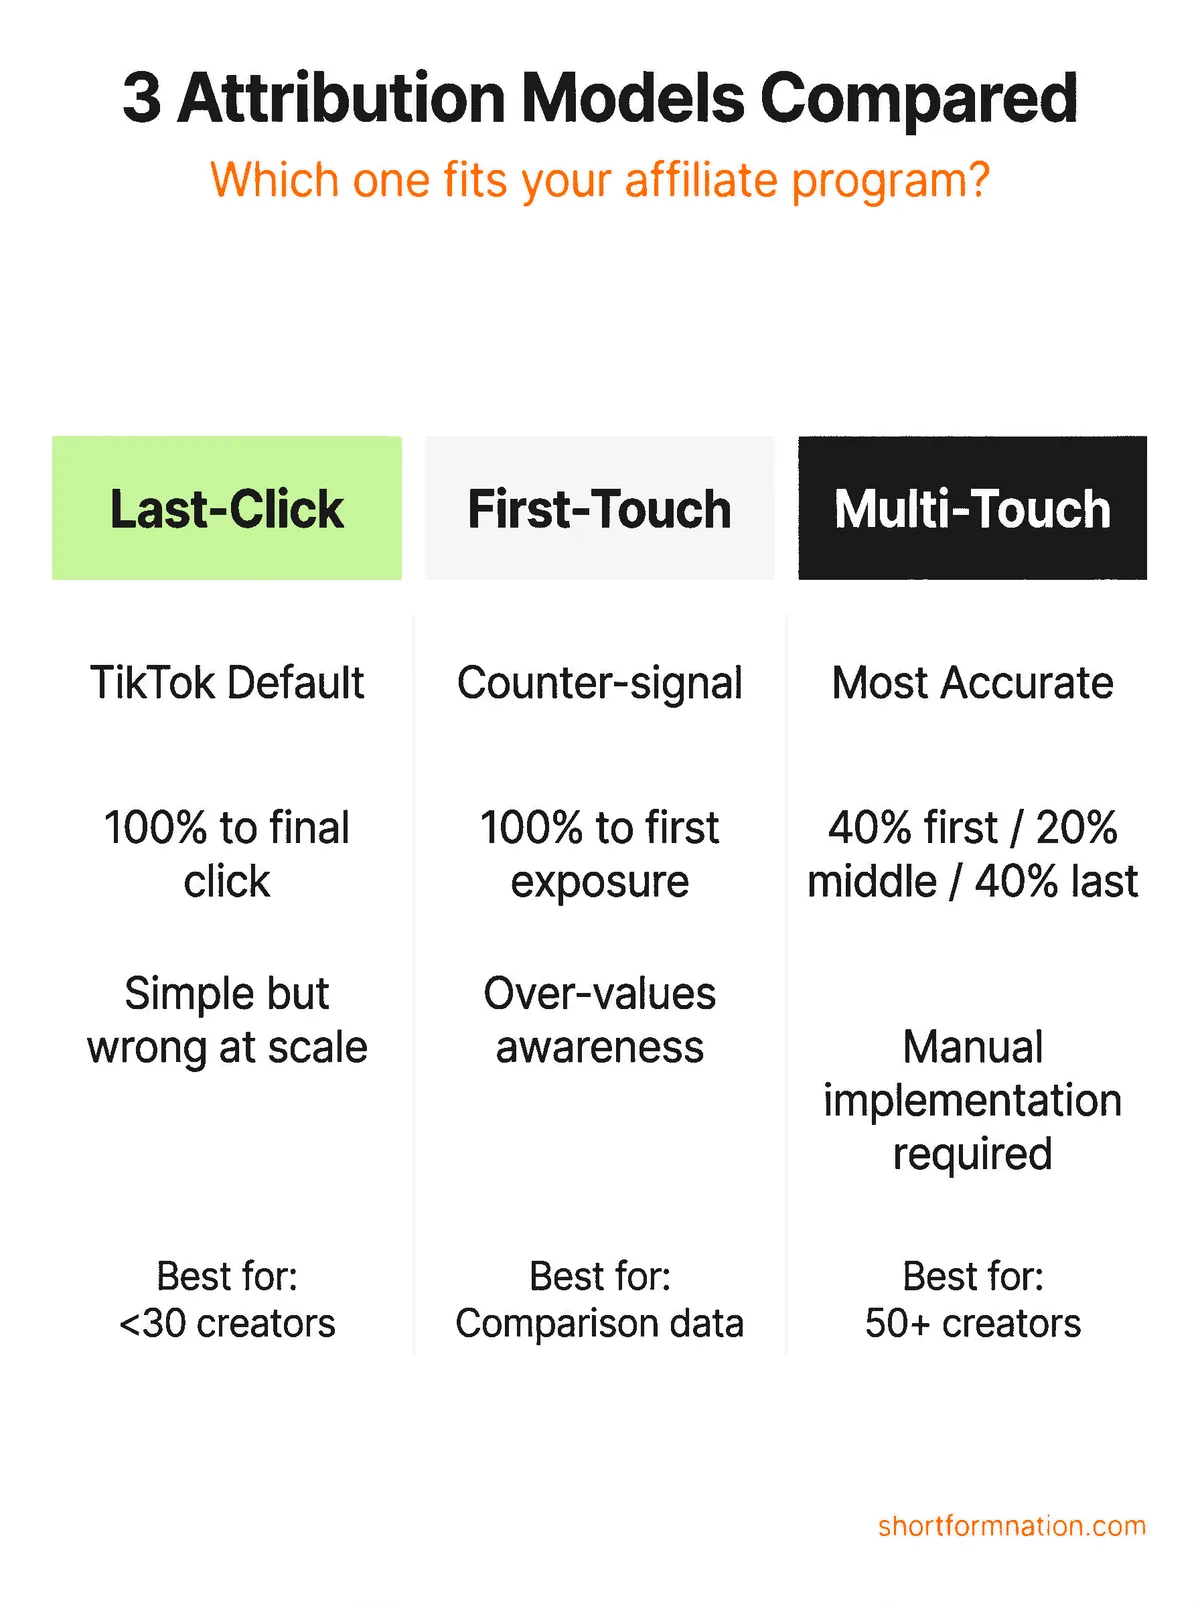
Five attribution models and when each one makes sense
TikTok Shop's default attribution model is last-click with a 30-day window. If a buyer clicks a creator's product link and purchases within 30 days, that creator gets full commission credit. For Targeted Collaboration partners, the window extends to 60 days.
This sounds reasonable until you map the actual buyer journey.
The average TikTok Shop buyer sees 3-5 pieces of creator content before purchasing. They might discover a product through a mega-creator's viral video (500K views, no immediate purchase), see it again in a mid-tier creator's demo (50K views, saves the video), and finally purchase through a nano-creator's comparison video two days later (5K views, product link click). The nano-creator gets 100% commission credit. The mega-creator — who did the heavy lifting of awareness — gets nothing.
This creates a structural incentive problem. Last-click attribution rewards bottom-of-funnel creators and penalizes top-of-funnel awareness drivers. Over time, this underinvestment in awareness creators shrinks your discovery pipeline while over-investing in converters who rely on someone else to do the demand generation.
Three Attribution Models Compared
Last-Click (TikTok Default): Simple, clean, and wrong for multi-creator programs. Works acceptably for programs under 30 creators where the buyer journey is short. Breaks down at scale.
First-Touch: The first creator a buyer engaged with gets full credit. Over-values awareness, under-values conversion. Useful as a counter-signal to last-click — if you run both, comparing the delta shows you which creators are undervalued.
Multi-Touch (Weighted): Distributes credit across all touchpoints. Most accurate but requires manual implementation since TikTok doesn't offer it natively. A common weighting: 40% first-touch, 20% middle interactions, 40% last-click.
Building a Manual Attribution Model
Since TikTok doesn't provide multi-touch attribution natively, here's how to approximate it:
Step 1: Export your affiliate order data from Seller Center weekly. This gives you last-click attribution by default.
Step 2: Cross-reference with TikTok's content analytics — which creators' videos had the most saves and shares in the same product category during the attribution window. Saves and shares are intent signals.
Step 3: Run a first-touch analysis by tracking which creators' videos had the most unique viewers who later purchased (even through a different creator's link). TikTok's Creator Marketplace data provides some of this.
Step 4: Weight the signals. A practical starting formula: Last-click creator gets 50% credit. Creators with the most saves/shares on the same product get 30% credit (split proportionally). First-touch creator (most unique views) gets 20% credit.
This isn't perfect. But it's dramatically more accurate than last-click alone, and it prevents you from systematically undervaluing the creators who actually build demand for your products.
For the step-by-step guide on setting up your affiliate campaign infrastructure (including analytics configuration), see: How to Set Up Your First TikTok Shop Affiliate Campaign.
Attribution isn't a solved problem. But ignoring it — which is what last-click does — isn't neutral. It actively distorts your investment decisions.
The Halo Effect: Measuring What TikTok Shop Doesn't Show You

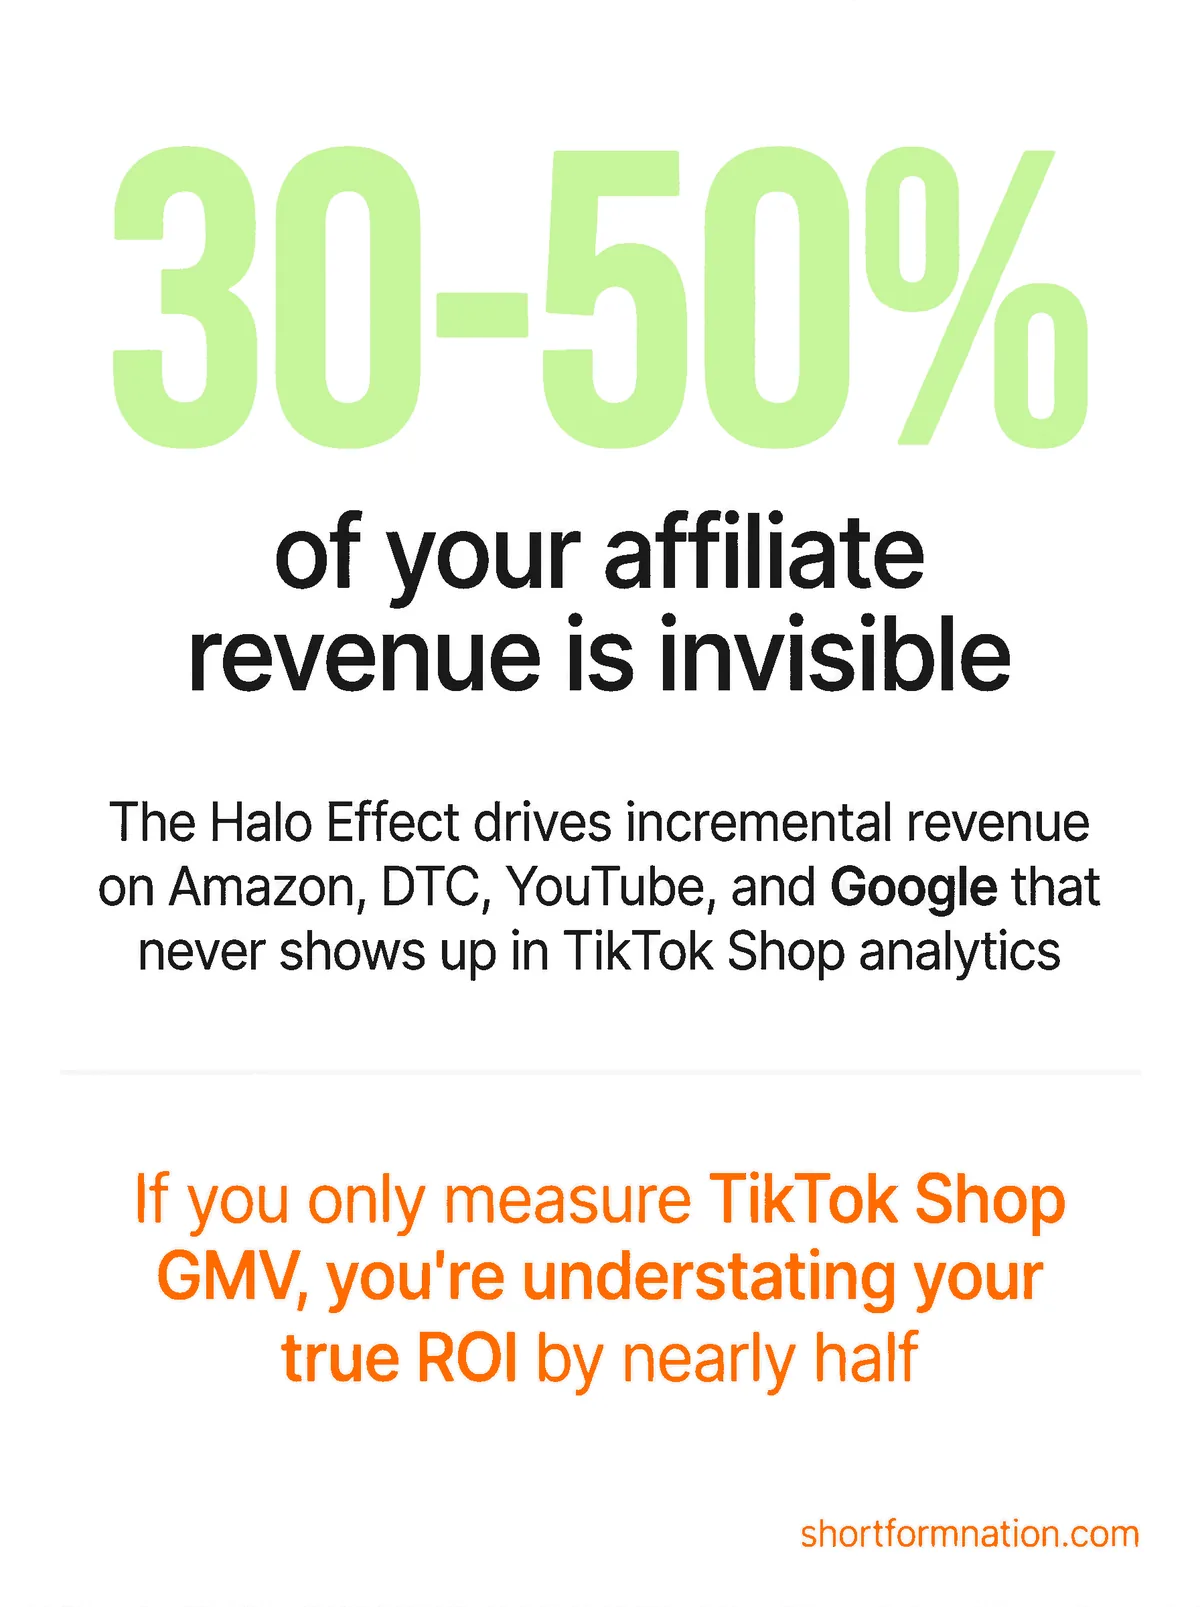
The Halo Effect — revenue you cannot see in Seller Center
TikTok Shop affiliate content drives purchases outside of TikTok. This is the Halo Effect — and it's the most undervalued metric in affiliate analytics.
When a creator posts a TikTok video reviewing your product, a percentage of viewers don't buy on TikTok. They search for the product on Amazon. They visit your DTC site directly. They watch a longer YouTube review. They Google your brand name. All of this incremental activity traces back to the TikTok exposure — but none of it shows up in your Seller Center dashboard.
Industry analysis across social commerce programs estimates the Halo Effect drives 30-50% of incremental revenue on platforms outside TikTok Shop. A brand generating $100K/month in TikTok Shop affiliate revenue is likely driving an additional $30K-$50K in Amazon, DTC, and YouTube revenue that they're not attributing to the affiliate program.
For the broader analysis of cross-platform dynamics in social commerce, see: Social Commerce Trends 2026: What's Actually Working on TikTok Shop.
How to Track the Halo Effect
Branded Search Correlation: Monitor Google Trends and Google Search Console for your brand name + product name. Chart weekly branded search volume against TikTok affiliate content volume. A consistent correlation (content spikes → branded search spikes 24-48 hours later) quantifies the awareness lift.
Amazon Brand Analytics: If you sell on Amazon, use Brand Analytics to track search frequency rank for your product keywords. Cross-reference against your TikTok affiliate content calendar. Tarte Cosmetics reportedly saw their Amazon search rank for key products improve 15-25% during periods of heavy TikTok creator activity.
UTM Tracking on DTC: Place unique UTM parameters in your creator briefs for any offsite links. Even though TikTok Shop purchases happen natively, some briefs include "link in bio" or direct-to-site CTAs for specific promotions. Track these through Google Analytics or your ecommerce platform.
Revenue Timing Analysis: The simplest Halo measurement: chart your non-TikTok revenue (Amazon + DTC + other channels) on a weekly basis. Overlay your TikTok affiliate content volume. If non-TikTok revenue consistently rises 2-5 days after TikTok content peaks, you're seeing the Halo Effect in action. The lag reflects the consideration period — viewers see TikTok content, then convert elsewhere within the week.
If you're only measuring TikTok Shop GMV, you're understating your true affiliate ROI by 30-50%. The Halo Effect is real, measurable, and most brands leave it completely off the table.
Building Your Reporting Cadence

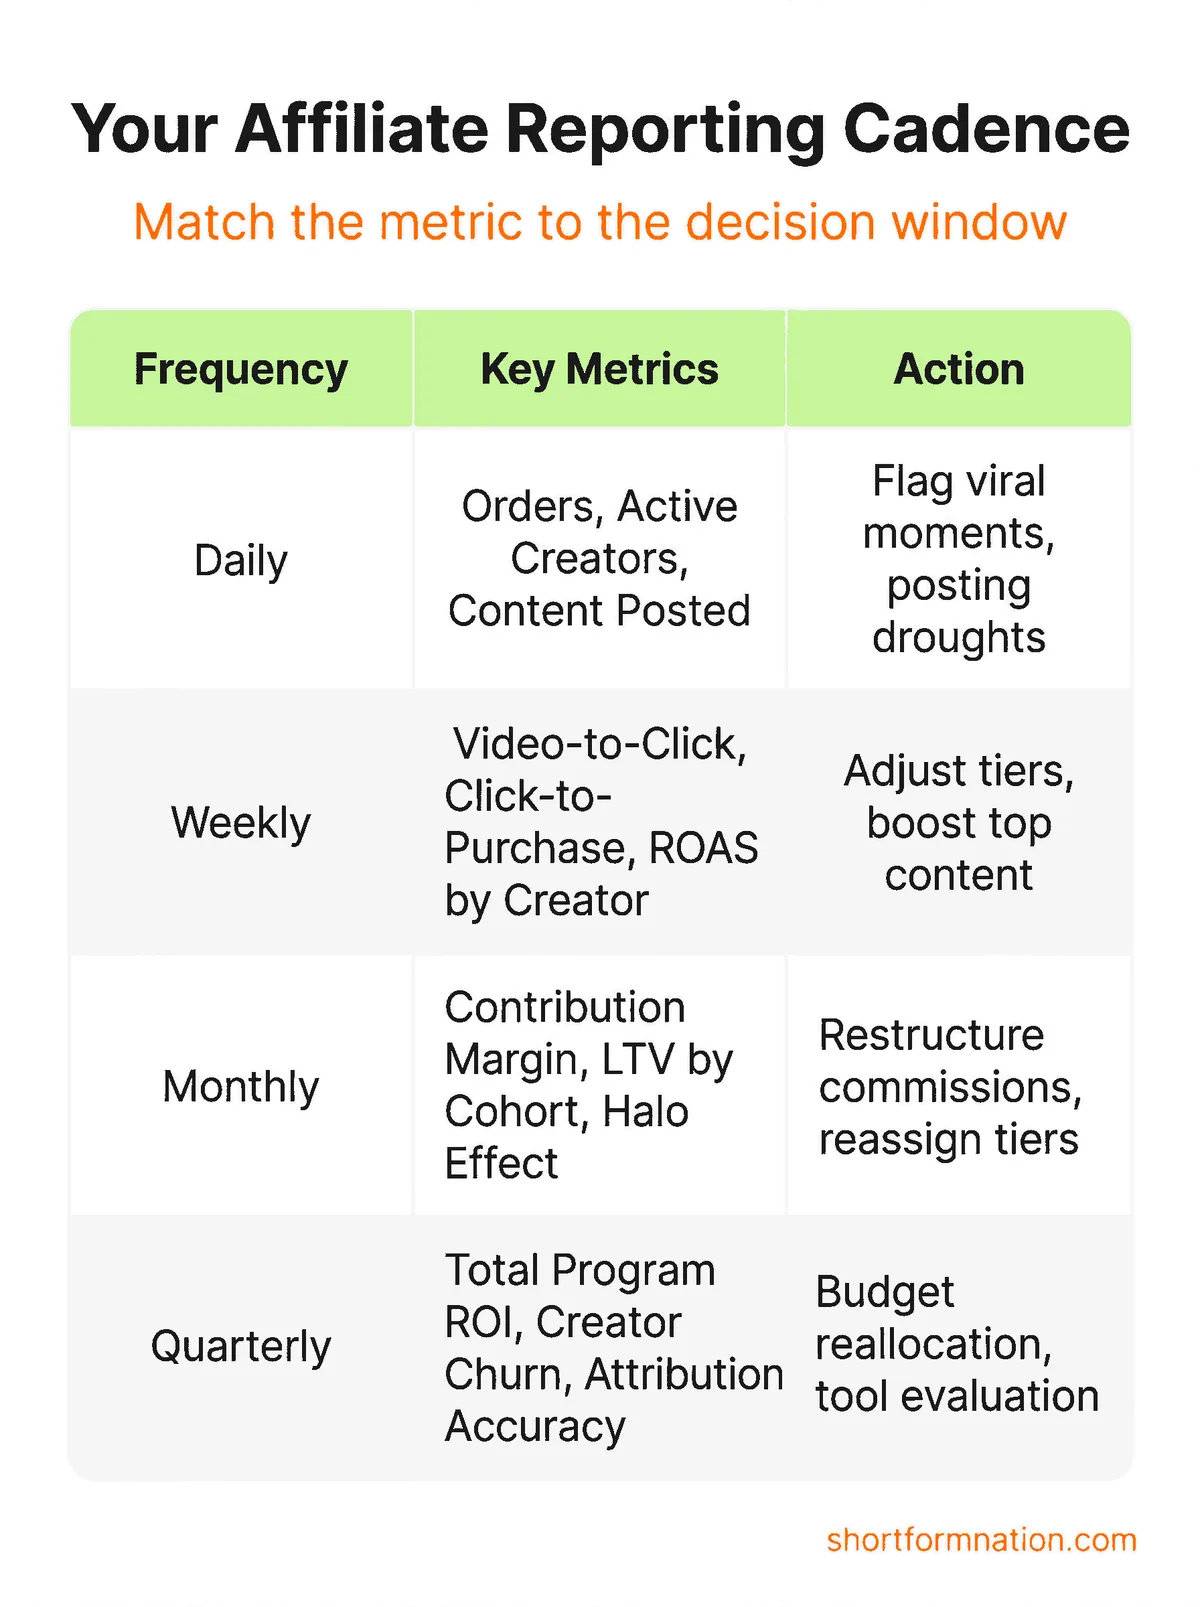
Match your reporting cadence to the decision window
The right metrics at the wrong frequency are useless. A daily contribution margin review is overkill. A monthly content velocity check is too late. Match the metric to the decision window.
| Frequency | What to Review | Metrics | Action |
|---|---|---|---|
| Daily | Active creators, trending content, order anomalies | Orders, active creator count, content posted | Flag viral moments for Spark Ads amplification. Flag posting droughts for outreach. |
| Weekly | Creator performance, content effectiveness, ROAS | Video-to-click rate, click-to-purchase rate, content velocity, coherence scores, blended ROAS by creator tier | Adjust commission tiers. Boost top content. Coach low-coherence creators. |
| Monthly | Product profitability, creator economics | Contribution margin per SKU, LTV by cohort, Halo Effect correlation, creator retention rate | Strategic commission restructuring. Product catalog adjustments. Creator tier reassignment. |
| Quarterly | Program-level ROI, market position | Total program ROI (including Halo), creator churn, competitive benchmarking, attribution model accuracy | Program-level investment decisions. Budget reallocation. Tool/platform evaluation. |
For programs with fewer than 50 creators, a weekly review handles most decisions. Above 50, the daily pass becomes essential — anomalies compound fast when you're managing hundreds of content pieces per week.
For how creator evaluation criteria feed into your weekly analytics review, see: How to Find and Recruit TikTok Shop Creators at Scale.
The teams that optimize weekly outperform the teams that review monthly. It's not the frequency — it's the feedback loop speed.
Tools and Intelligence: From Dashboards to Decisions
Native TikTok Shop analytics give you a starting point — but they cap out fast. Here's the realistic tool landscape. For a comprehensive comparison of every TikTok Shop tool by category, pricing, and data source, see: Best TikTok Shop Tools for Brands in 2026: The Definitive Guide.
TikTok Seller Center (Free, Built-In)
What it shows: GMV, orders, commission payouts, active affiliates, product-level performance. What it doesn't: content-level analytics, creator-level conversion rates, attribution modeling, cross-platform Halo Effect. It's your Layer 1 data source. Necessary but not sufficient for programs past 30 creators.
TikTok also launched its Off-Site Performance Analysis tool in late 2024, adding pixel-based tracking with 7, 28, and 90-day attribution windows for advertisers. This is a step toward cross-platform measurement, but it's designed for paid ads — not organic affiliate content.
Third-Party Analytics (Kalodata, FastMoss)
These platforms track product trends, competitor analytics, and category benchmarks across TikTok Shop. Kalodata excels at market-level intelligence — trending products, category GMV, competitor creator rosters. FastMoss provides creator discovery and performance tracking. Cost: $500-2,000/month. They fill the competitive intelligence gap but don't solve creator-level content quality measurement.
Intelligence Platforms
For programs managing 50+ creators, the measurement bottleneck isn't data — it's interpretation. You have the numbers. You don't have time to analyze 200 videos per week against brief guidelines, score content coherence, or identify which angles are driving conversion patterns.
SFN AI's TikTok Shop intelligence platform approaches this differently. Its Coherence Scoring system analyzes every posted video against recommended content patterns, generating a 0-100% score that measures alignment between the brief and the execution. The Alert Feed surfaces what needs human attention — off-script content, missed talking points, posting droughts, low coherence scores — so you only review what matters. Creators scoring 90%+ on coherence average 6.9x higher earnings per video. That's the gap between guessing and measuring.
For teams not ready for a dedicated platform, the manual approach works — it just doesn't scale. Weekly video reviews against brief checklists, spreadsheet-based ROAS calculations, and Google Trends correlation for Halo Effect tracking can carry a program to about 50 creators. Beyond that, the math demands better tools.
Building an Analytics-First Affiliate Program
The pattern across every program that scales profitably is the same: they measure before they optimize, and they optimize before they scale.
Start with Layer 1 metrics. Get your GMV, order, and active creator baseline stable. Then build Layer 2 — content velocity, conversion rates, coherence scoring. This is where you find the signal: which creators convert, which content formats work, which product-creator pairings are profitable.
Only after Layers 1 and 2 are instrumented should you invest in Layer 3 financial metrics. Contribution margin per SKU, LTV:CAC, and blended ROAS require clean data from the first two layers. Garbage in, garbage out — and most programs skip straight to ROAS calculations on messy data.
The attribution model doesn't need to be perfect. It needs to be directional. Last-click plus a first-touch estimate is better than last-click alone. A weekly Halo Effect correlation check is better than ignoring 30-50% of your program's true revenue.
SFN AI's intelligence platform automates the measurement layer that breaks manual programs at scale — Coherence Scoring, Alert Feed, creator-level analytics, and pattern detection across your entire roster. For teams running 50+ creators, it's the difference between spreadsheets and systems. For teams not there yet, the Three-Layer Metrics Framework in this guide gives you the manual playbook to get started.
The programs that win on TikTok Shop aren't the ones with the most creators. They're the ones that know exactly which creators, content, and products are driving profitable revenue — and can prove it.
Ready to build an analytics-first program?
Join SFN AI or reach out at support@shortformnation.com to discuss your measurement strategy.
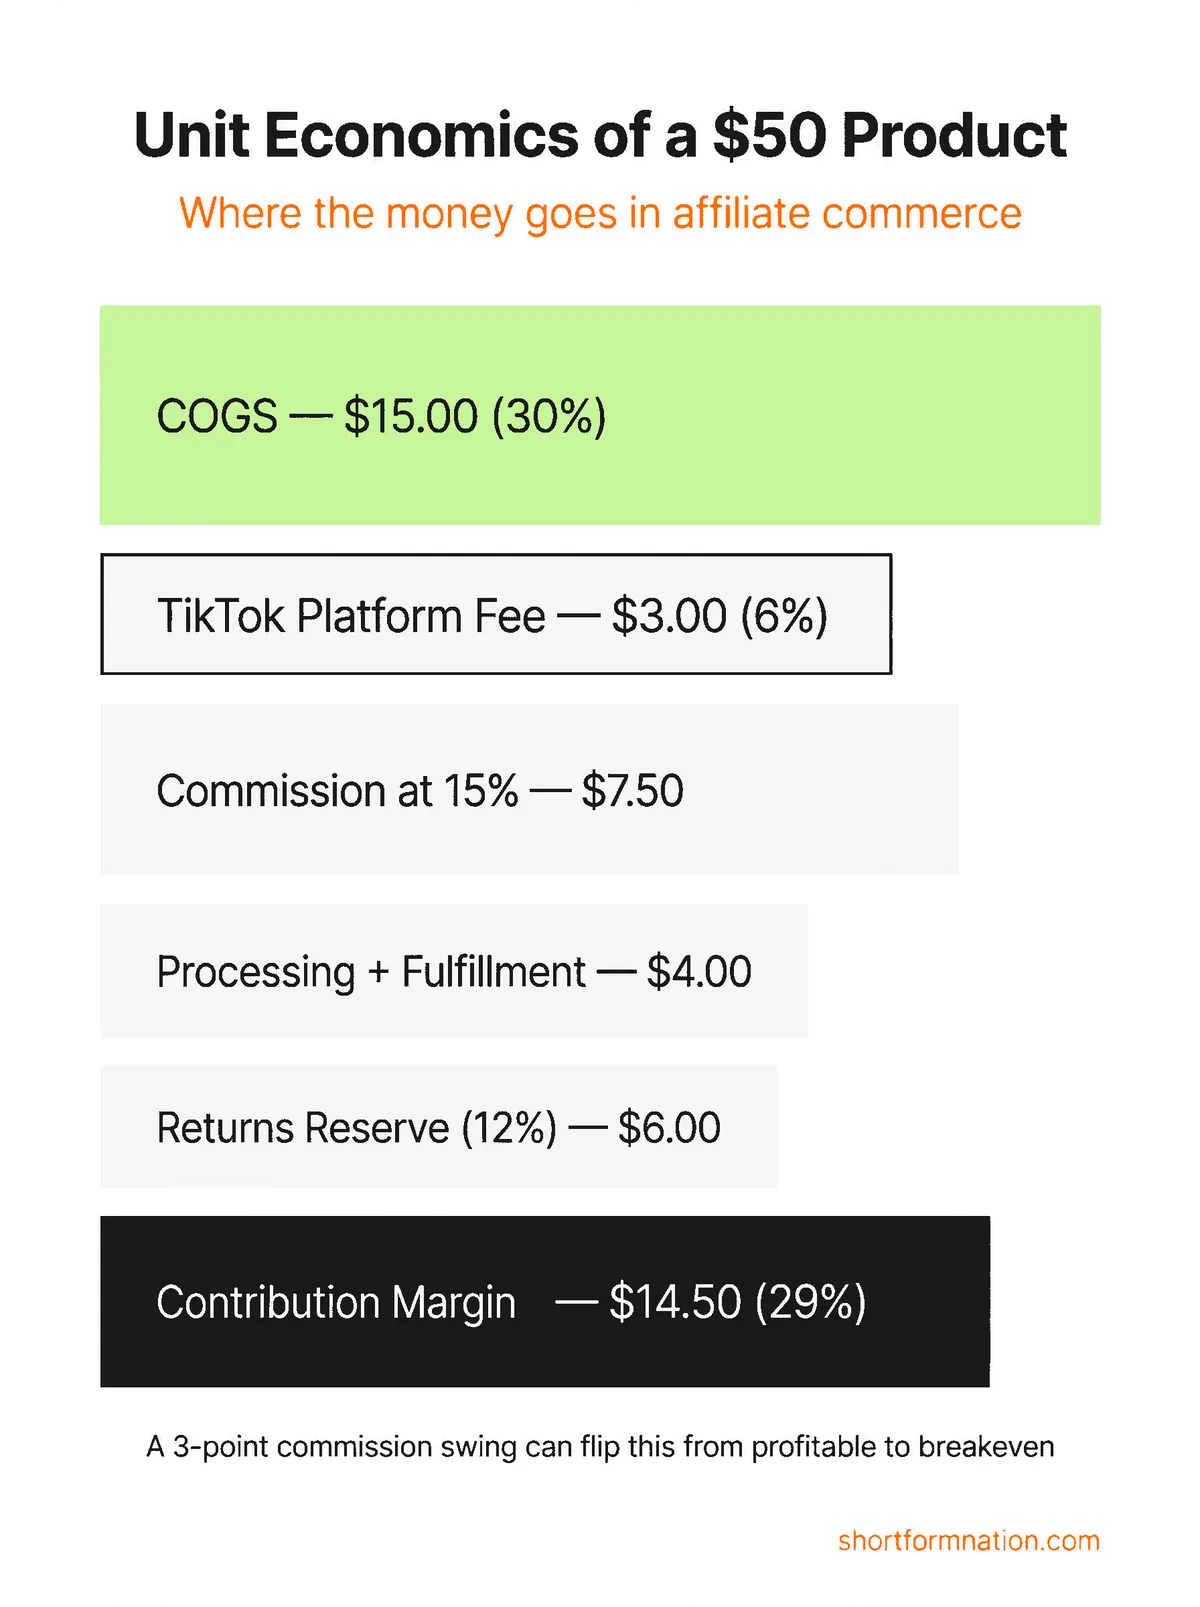
Unit economics — the number that determines if your affiliate program is actually profitable
Frequently Asked Questions
What metrics should I track for my TikTok Shop affiliate program?
Track three layers: foundational metrics (GMV, orders, AOV, active creator count), conversion metrics (video-to-click rate, click-to-purchase rate, content velocity, coherence scores), and financial metrics (blended ROAS, contribution margin per SKU, LTV:CAC ratio). Most programs only track the first layer and miss the signals that determine profitability.
How does TikTok Shop affiliate attribution work?
TikTok Shop uses last-click attribution with a 30-day window (60 days for Targeted Collaboration). The last creator whose product link a buyer clicked before purchasing receives full commission credit. This model undervalues awareness-stage creators who introduce products to new audiences but don't receive the final click.
What is the Halo Effect in TikTok Shop affiliate marketing?
The Halo Effect is the incremental revenue that TikTok Shop affiliate content drives on other platforms — Amazon, DTC sites, YouTube, and Google. Industry estimates put this cross-platform lift at 30-50% of additional revenue beyond what shows in TikTok Shop analytics. Most brands don't measure it, which means they understate their true affiliate ROI by nearly half.
What ROAS should I target for TikTok Shop affiliates?
A healthy TikTok Shop affiliate program targets 5:1 or better blended ROAS (total affiliate GMV divided by total program costs including commission, management, samples, and tools). Below 3:1 indicates a need to restructure commissions or optimize creator performance. Top-performing programs with intelligence-driven analytics achieve 8:1 or higher.
How often should I review TikTok Shop affiliate analytics?
Daily for operational metrics (orders, active creators, content posted). Weekly for performance metrics (ROAS by creator, content velocity, coherence scores). Monthly for financial metrics (contribution margin per SKU, LTV by cohort). Quarterly for strategic review (total program ROI, competitive positioning, attribution model accuracy).